Dwi Wahyudi
Senior Software Engineer (Ruby, Golang, Java)
In this article, we’re going to demonstrate on how we can monitor our Golang application with Jaeger, an OpenTracing tracing implementation.
Overview
In our development cycle, it’s quite rare to think about monitoring and tracing, until we deploy it in production, where we need better insights on how our application runs, how our application performs, where do our applications go, etc. Plenty of times, we need detailed insights on the data being processed, what kind of data, what is the value, where do they go, can we give each process some kind of tags (so we can categorize and group them later?), etc. That’s what monitoring and tracing are all about. Generally we want to know about these 3 things:
- Logs: a piece of information from a context (a single request, a single task, etc). This information can be anything from simple data values (related to the application) to IP addresses and even a complete query (if we need to debug something in production), just don’t log anything confidential.
- Traces: a series (chain) of information about the process whereabouts, how long the process needs to be processed on each system (server, DB, etc). In distributed system, it is also neat to pass around a unique ID between each service so that we can trace application activities between services/applications (that’s why we call it “distributed”).
- Metrics: which are numbers, like successful/failed requests count, average/cumulative duration of requests, etc.
There are some commercial monitoring and tracing platforms available on the web. But here in this article, we’re going to use Jaeger (an OpenTracing implementation). OpenTracing is a specification, while Jaeger is just one of the tracers. We can find out more tracers here. The advantage of using OpenTracing is that it is not vendor-locked, means that in order to monitor/trace our applications, we don’t need to make our code depends on any commercial vendor libraries. We can change the tracer (backend implementation for the OpenTracing) (let say to Zipkin or Datadog) with small configurations change.
Before we write any Golang code, let’s install Jaeger first. Jaeger is very simple to setup and easy to use, the UI is also pretty straight-forward.
Installing the Jaeger
We can visit this page: https://www.jaegertracing.io/download/, there are 2 options we can choose, via binaries or docker images. We’re going to utilize the Jaeger Docker image. Let’s run Jaeger via Docker with this command in terminal:
docker run -d --rm -p 6831:6831/udp -p 6832:6832/udp -p 16686:16686 -p 14268:14268 -p 14250:14250 --name jaeger -ti jaegertracing/all-in-one
If everything goes OK, we can inspect the container via docker container ls command, the output would be like this:
CONTAINER ID   IMAGE                      COMMAND                  CREATED         STATUS         PORTS                                                                                                                                NAMES
57c792fd5ec6   jaegertracing/all-in-one   "/go/bin/all-in-one-…"   4 seconds ago   Up 3 seconds   0.0.0.0:14250->14250/tcp, 0.0.0.0:14268->14268/tcp, 5775/udp, 5778/tcp, 0.0.0.0:6831-6832->6831-6832/udp, 0.0.0.0:16686->16686/tcp   jaeger
There are some ports exposed by the image, the web interface is using 16686 port, to which we can visit locally with: http://localhost:16686.
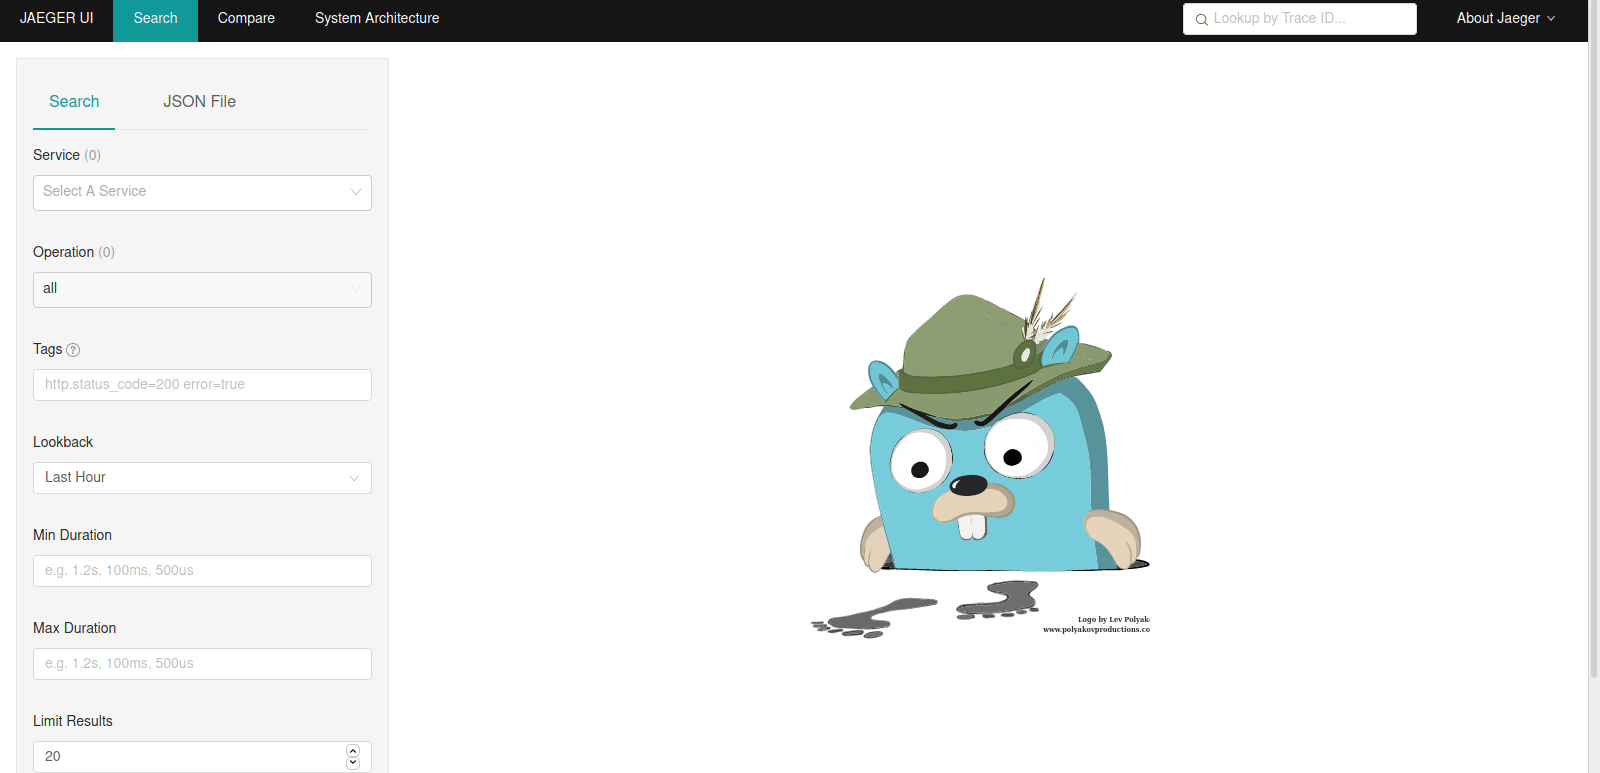
The page is empty for now, because we haven’t send any data to it. let’s write some Golang code.
Our Golang App
Let’s start to initialize a new Golang application:
go mod init jaegerlearn

go get github.com/uber/jaeger-lib
go get github.com/uber/jaeger-client-go
In order to send data to OpenTracing, we’re going to use this library: https://github.com/opentracing/opentracing-go, as we can see, this library is related to OpenTracing, so any supported tracers https://opentracing.io/docs/supported-tracers/, can use this library. Because we’re going to use Jaeger, we also need to install libraries related to Jaeger.
Configuration
Before we move, let’s write some imports first, some of these use custom package aliases for better clarity.
import (
	opentracing "github.com/opentracing/opentracing-go"
	"github.com/opentracing/opentracing-go/log"

	"github.com/uber/jaeger-client-go"
	jaegercfg "github.com/uber/jaeger-client-go/config"
	jaegerlog "github.com/uber/jaeger-client-go/log"
	"github.com/uber/jaeger-lib/metrics"
)
Let’s start by doing some configurations for our instrumentation via Jaeger:
	cfg := jaegercfg.Configuration{
		ServiceName: "test",
		Sampler: &jaegercfg.SamplerConfig{
			Type:  jaeger.SamplerTypeConst,
			Param: 1,
		},
		Reporter: &jaegercfg.ReporterConfig{
			LogSpans: true,
		},
	}
For above configurations:
- We give our service name just
test. - We set the sampling constant of 1. This instructs the tracing library to always send the traces to Jaeger. There are some other configurations we can use: https://www.jaegertracing.io/docs/1.22/sampling/, maybe we want to only send 1 out of 10 traces to Jaeger. Why do we do this? Because storing tracing data can sometimes become expensive if they’re massive.
- For the reporter configurations, we’re going to log the spans as well.
- There are other configurations that we can set as well, take a look at the documentations: https://pkg.go.dev/github.com/uber/jaeger-client-go@v2.25.0+incompatible/config.
With cfg configurations, we can now create the tracing instance with specified logger and metrics for Jaeger. For now we’re going to use metrics.NullFactory, in the future article, we’re going to demonstrate to use Jaeger with Prometheus (a tool to gather metrics from a service) and visualize it with Grafana.
	jLogger := jaegerlog.StdLogger
	jMetricsFactory := metrics.NullFactory

	tracer, closer, _ := cfg.NewTracer(
		jaegercfg.Logger(jLogger),
		jaegercfg.Metrics(jMetricsFactory),
	)

	opentracing.SetGlobalTracer(tracer)
	defer closer.Close()
Spans
In OpenTracing, traces are defined by spans, that is, a root span will show up in Jaeger as an entry for each activity in our application.
Let’s create a span to send it to Jaeger.
	tracer2 := opentracing.GlobalTracer()

	parentSpan := tracer2.StartSpan("say-hello")
	parentSpan.Finish()
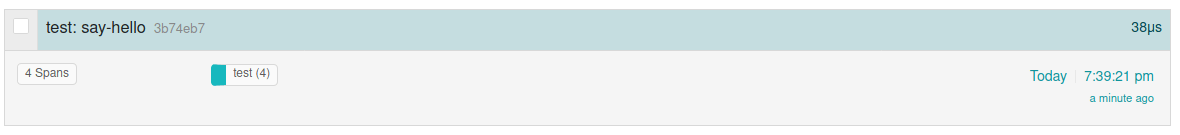
Let’s run this, after sending this span to Jaeger, we will see that now there’s an entry in Jaeger. We need to search the service name of test (as specified by above config code), and we need to look for say-hello operation. Each entry give us the timestamp and duration for each trace of span(s).
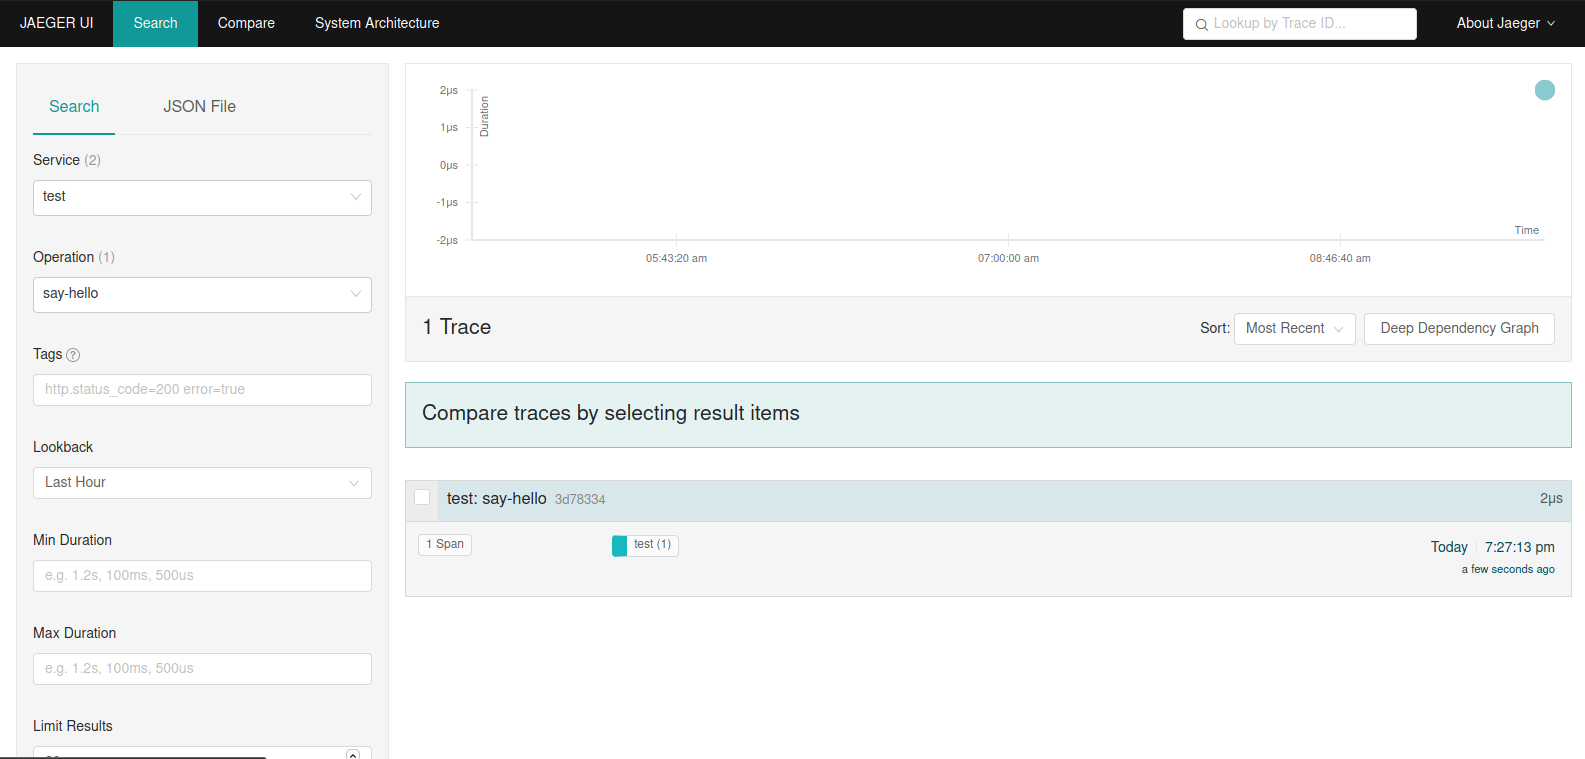
The entry is clickable. When we click it, we will see the detail of the span.
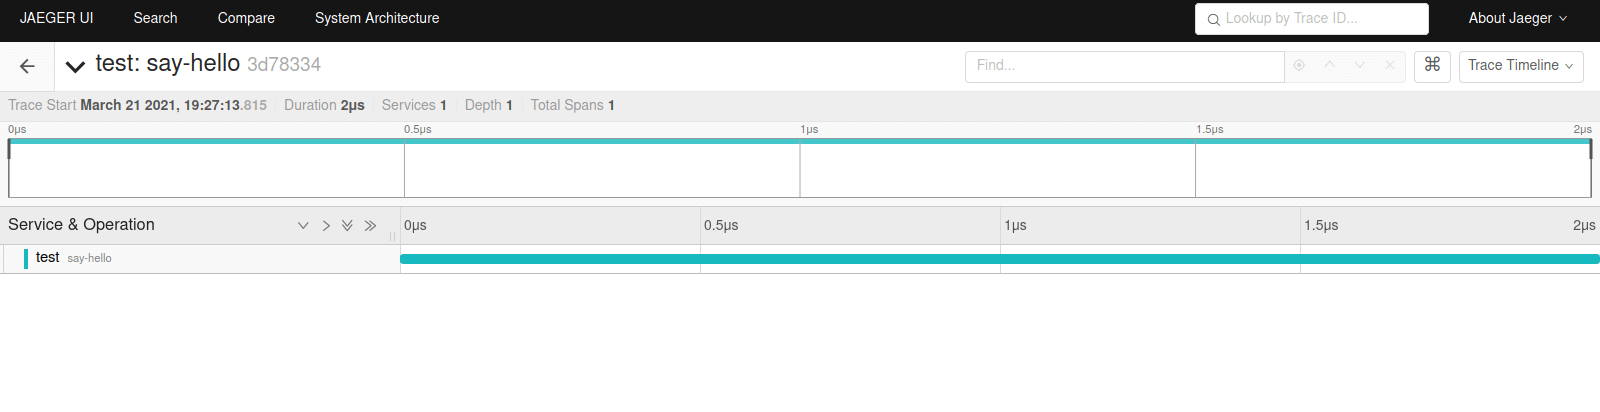
There we can see a single span, it is clickable as well.
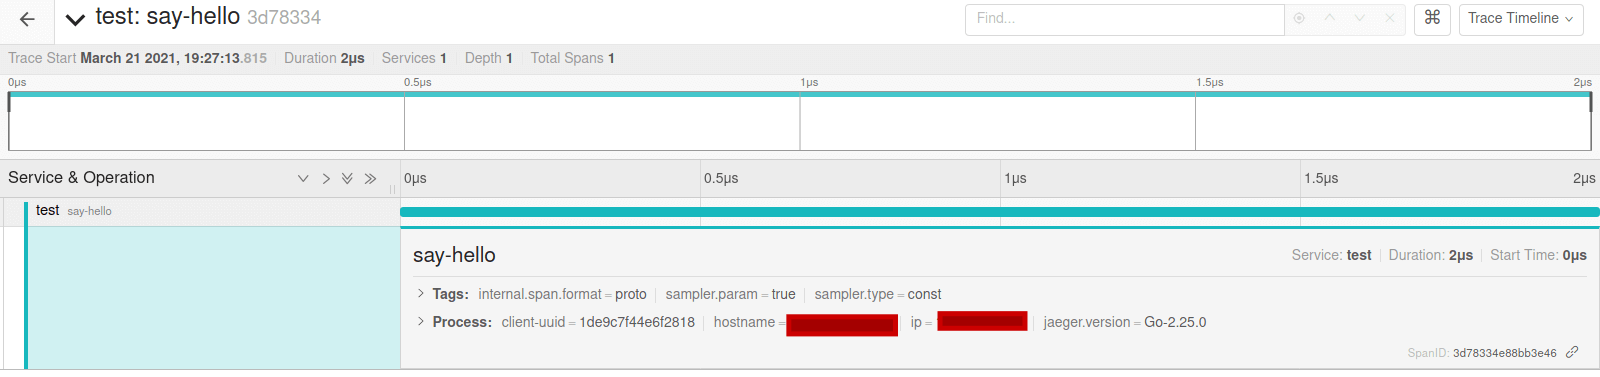
We give each span a name. Each span can have tags and baggage items. Each span can also have a set of key value logs.
Nested Spans
Each span can have children spans (nested spans), each child can have other children as well. According to the specification https://opentracing.io/specification/, the spans have DAG structure (directed acyclic graph).
	// Child span
	childSpan := tracer.StartSpan(
		"child",
		opentracing.ChildOf(parentSpan.Context()),
	)
	defer childSpan.Finish()

	// Child2 span
	child2Span := tracer.StartSpan(
		"child2",
		opentracing.ChildOf(parentSpan.Context()),
	)
	defer child2Span.Finish()

	// Grandchild span
	grandchildSpan := tracer.StartSpan(
		"grandchild",
		opentracing.ChildOf(childSpan.Context()),
	)
	if sc, ok := grandchildSpan.Context().(jaeger.SpanContext); ok {
		fmt.Println(sc.TraceID())
	}
	defer grandchildSpan.Finish()
childSpan is the child of the root span parentSpan. Only parentSpan will be shown and represented at the homepage of Jaeger UI. The nested children inside it will be shown when we see its detail. We can assume that the root span is the starting point for an activity in our application(s). It can span multiple services, servers, programming languages, etc.
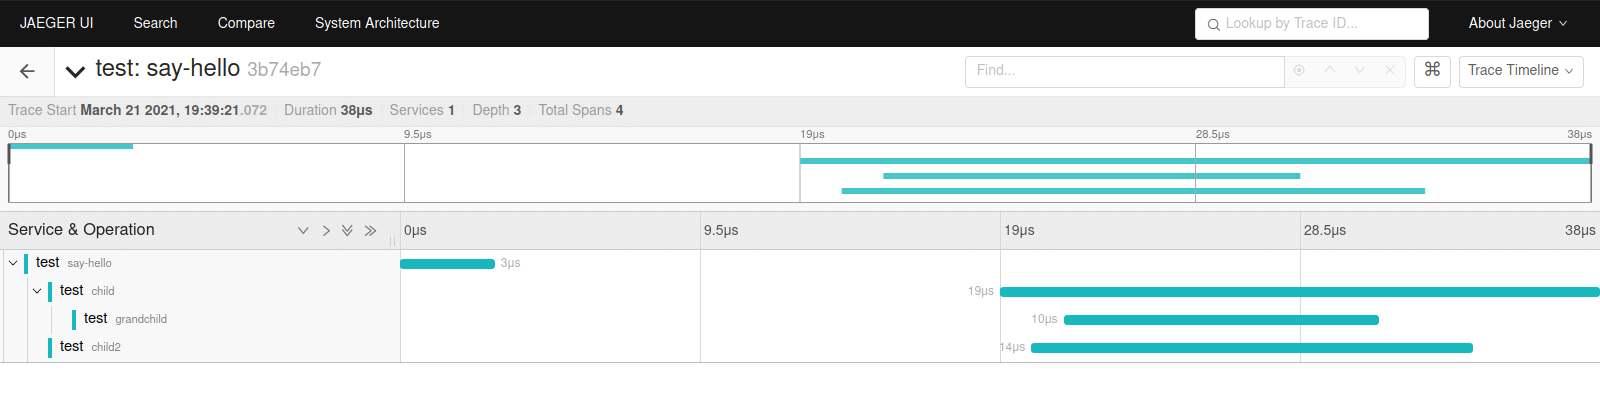
Let’s run the code, and we’ll see a new entry containing 4 spans. And if we look at the Search form, the Operation filter now have above 4 operations (say-hello, child, child2 and grandchild) for us to choose. All of these operations are still inside our test service. A service has many operations. An operation contain 1 root span and may have multiple nested children and grandchildren and grand-grandchildren and so on spans.
Above code is only sample, resulting span will not be in order, we usually put a span for a single function, because calling to Finish will set the end timestamp for that span.
When we see the detail of the span, we’ll see each of those spans.
Log Fields, Baggage Items and Tags
There are other things that we can embed to our spans, which are log fields, baggage items and tags.
- Log fields are key values pairs for logging specific data values inside the span. Log fields apply to the specific moment or event inside the span, not the whole span. A span might have many log fields.
- Baggage items are data that can be carried out to other spans even in other processes, let say we create some baggage items in a span in our Golang application that can be read later by a Java application. Be very careful not to overuse this as it will use more traffic and memory across services/applications.
- Tags can be used to tag some spans, spans can have zero to many tags. By tagging the spans we can search them more easily via Jaeger search form. Unlike log fields, a tag applies to the whole span.
OpenTracing specifies several standard log fields and tags: https://github.com/opentracing/specification/blob/master/semantic_conventions.md.
Let’s put log fields, baggage items and tags for childSpan.
	// Log fields
	// moment 1
	childSpan.LogFields(
		log.String("event", "purchase"),
		log.Float64("price", 780),
		log.Bool("is_validated", true),
	)
	// moment 2
	childSpan.LogFields(
		log.String("event", "checkout"),
		log.Float64("final_price", 78),
	)
	childSpan.SetBaggageItem("baggage", "99999")  // Baggage Items
	childSpan.SetTag("category", "fresh-produce") // Tags
	defer childSpan.Finish()

	// Child2 span
	child2Span := tracer.StartSpan(
		"child2",
		opentracing.ChildOf(parentSpan.Context()),
	)
	defer child2Span.Finish()
Let’s run the Go application and send these trace (with log fields, tags and baggage items) to Jaeger.
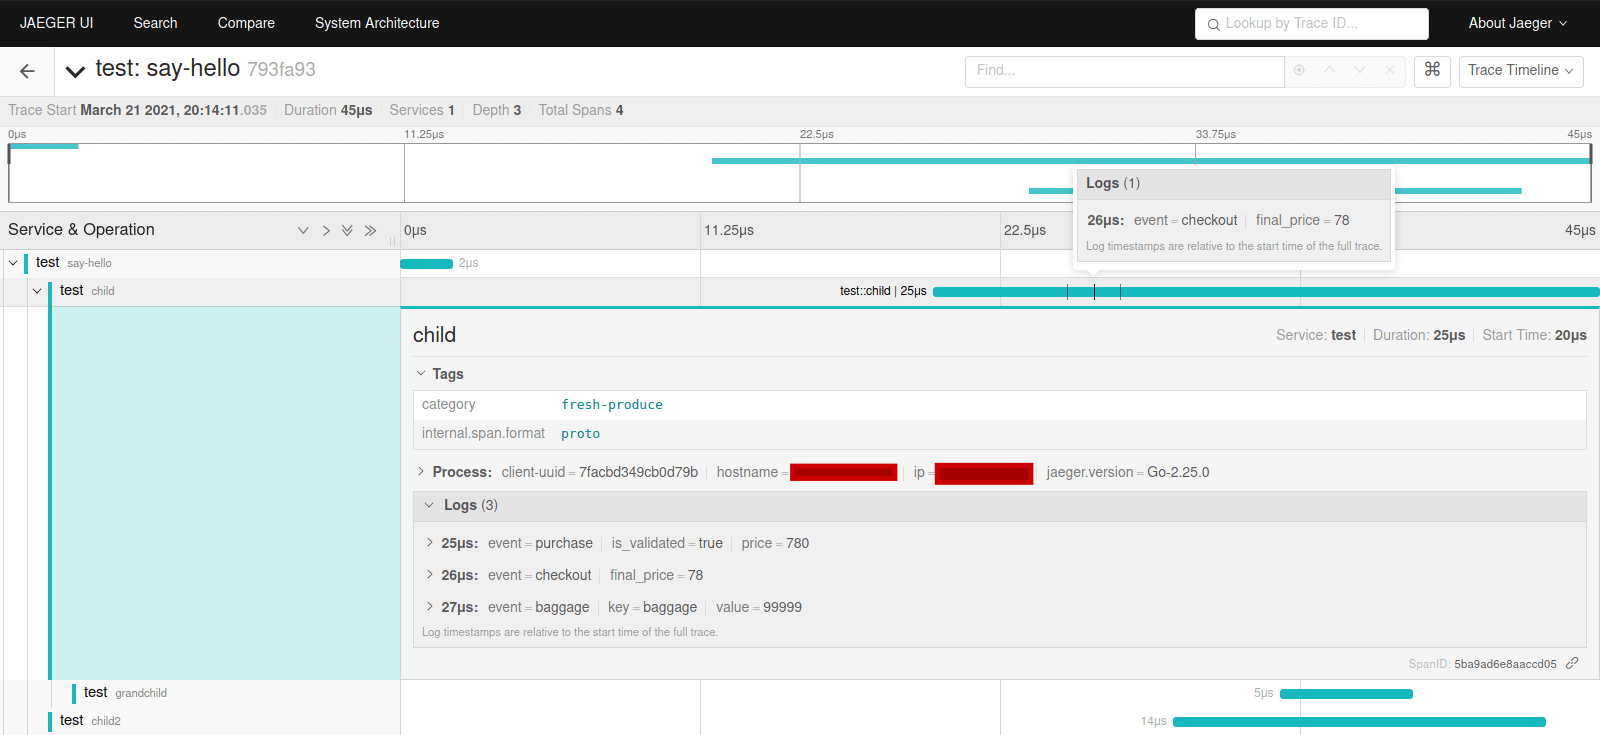
As we can see above, tag of category with value fresh-produce applies to the whole child span, while logs has specific markers denoting specific (not whole) moments inside the span.
Here’s the demonstration code: https://github.com/dwahyudi/golang-jaeger-demo
Up to this moment, we’ve been tracing only 1 service / 1 application. We can leverage OpenTracing inject and extract feature to create distributed tracing for multiple services/applications.
Distributed Tracing
Distributed Tracing means to do tracing for more than 1 service/application. A service doesn’t need to be written in Golang, other programming languages can use OpenTracing as well.
OpenTracing allows us to continue the tracing by injecting (serializing) span context (store it in request header for http requests, or else transmit the span context as text) and extracting (deserializing) it in another service/application. This is how we do distributed tracing.
Other than request header, we can also create span context injection for services that use something like RabbitMQ or Redis. We put the span context as the value in RabbitMQ or Redis. But in this article, we’re going to demonstrate the injection of span context in http request header. We’re going to create 3 web servers with Golang, web-a, web-b and web-c. The flow will be: web-a will call web-b, and web-b will call web-c, we then request web-a to get values from all of those 3 services.
Here’s web-a:
func main() {
	cfg := jaegercfg.Configuration{
		ServiceName: "web-a",
		Sampler: &jaegercfg.SamplerConfig{
			Type:  jaeger.SamplerTypeConst,
			Param: 1,
		},
		Reporter: &jaegercfg.ReporterConfig{
			LogSpans: true,
		},
	}

	jLogger := jaegerlog.StdLogger
	jMetricsFactory := metrics.NullFactory

	tracer, closer, _ := cfg.NewTracer(
		jaegercfg.Logger(jLogger),
		jaegercfg.Metrics(jMetricsFactory),
	)
	opentracing.SetGlobalTracer(tracer)
	defer closer.Close()

	// Web server
	http.HandleFunc("/greet", greet)
	http.ListenAndServe(":8888", nil)
}

func greet(w http.ResponseWriter, req *http.Request) {
	span, _ := opentracing.StartSpanFromContext(req.Context(), "handler.greet")
	defer span.Finish()

	httpClient := &http.Client{}
	httpReq, err := http.NewRequest("GET", "http://localhost:9999/receive-greet", nil)
	if err != nil {
		log.Panic(err)
	}

	// From span above we want to connect the tracing with web-B.
	opentracing.GlobalTracer().Inject(
		span.Context(),
		opentracing.HTTPHeaders,
		opentracing.HTTPHeadersCarrier(httpReq.Header))

	resp, err := httpClient.Do(httpReq)
	if err != nil {
		log.Panic(err)
	}
	defer resp.Body.Close()

	bytes, err := ioutil.ReadAll(resp.Body)
	if err != nil {
		log.Panic(err)
	}

	fmt.Fprintf(w, "response from web B: %v", string(bytes))
}
web-a will have Jaeger service with the same name. It exposes a web server at port 8888 and endpoint /greet for us to call. Such endpoint when called will be handled by greet function. Inside the greet function above, we create a span: handler.greet, and then we call web-b (port 9999 with endpoint receive-greet).
We can see that we try to inject the span context span.Context() into the httpReq.Header. We then get the response from web-b and return it as response.
Now let’s create web-b:
func main() {
	cfg := jaegercfg.Configuration{
		ServiceName: "web-b",
		Sampler: &jaegercfg.SamplerConfig{
			Type:  jaeger.SamplerTypeConst,
			Param: 1,
		},
		Reporter: &jaegercfg.ReporterConfig{
			LogSpans: true,
		},
	}

	jLogger := jaegerlog.StdLogger
	jMetricsFactory := metrics.NullFactory

	tracer, closer, _ := cfg.NewTracer(
		jaegercfg.Logger(jLogger),
		jaegercfg.Metrics(jMetricsFactory),
	)
	opentracing.SetGlobalTracer(tracer)
	defer closer.Close()

	// Web server
	http.HandleFunc("/receive-greet", receiveGreet)
	http.ListenAndServe(":9999", nil)
}

func receiveGreet(w http.ResponseWriter, req *http.Request) {
	var serverSpan opentracing.Span
	wireContext, _ := opentracing.GlobalTracer().Extract(
		opentracing.HTTPHeaders,
		opentracing.HTTPHeadersCarrier(req.Header))

	// when wireContext is nil, it will create its own root span (from request context).
	serverSpan, ctx := opentracing.StartSpanFromContext(
		req.Context(),
		"handler.receiveGreet",
		ext.RPCServerOption(wireContext))

	defer serverSpan.Finish()

	webCResponse := callWebC(ctx)

	fmt.Fprintf(w, "hello from web B, response from web C: %v", webCResponse)
}

func callWebC(ctx context.Context) string {
	span, _ := opentracing.StartSpanFromContext(ctx, "call-web-C")
	defer span.Finish()

	httpClient := &http.Client{}
	httpReq, err := http.NewRequest("GET", "http://localhost:3333/receive-greet", nil)
	if err != nil {
		log.Panic(err)
	}

	// from span above, connect tracing to web-C.
	opentracing.GlobalTracer().Inject(
		span.Context(),
		opentracing.HTTPHeaders,
		opentracing.HTTPHeadersCarrier(httpReq.Header))

	resp, err := httpClient.Do(httpReq)
	if err != nil {
		log.Panic(err)
	}
	defer resp.Body.Close()

	bytes, err := ioutil.ReadAll(resp.Body)
	if err != nil {
		log.Panic(err)
	}

	return string(bytes)
}
In web-b above, we create a server with port 9999 and endpoint /receive-greet. When called, it will be handled by receiveGreet function. Inside receiveGreet function, we extract wireContext from http header.
- If
wireContextis nil,serverSpan, ctx := opentracing.StartSpanFromContext(will create a root span forweb-b, that is, if we callweb-bdirectly, not fromweb-a. - If
wireContextis not nil (which means we callweb-bfromweb-a), OpenTracing will continue the tracing from that span context.
We then pass the context of serverSpan to callWebC. Inside callWebC, we create another span call-web-C, and do http request to web-c. Again, calling to web-c, we inject the span context in http request header, this span context is the continuation from web-a.
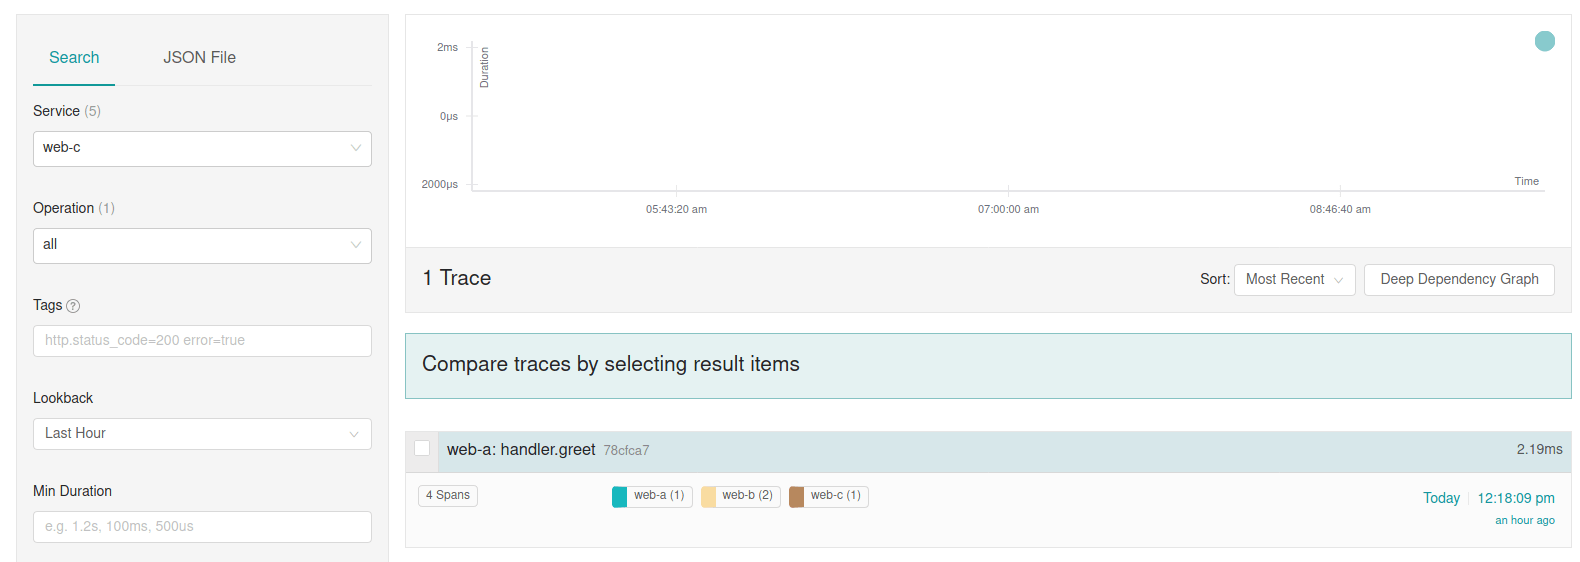
When we run all of those web-a, web-b and web-c. We can request to any of them.
- If we request to
web-a, the tracing would beweb-a,web-bthenweb-c. Jaeger UI will show all of those 3 entries if we filterweb-a,web-b, orweb-cservice. - If we request to
web-b, the tracing would beweb-bthenweb-c. Jaeger UI will show all of those 2 entries if we filterweb-b, orweb-cservice. - If we request to
web-c, the tracing would beweb-conly. Jaeger will only showweb-centry if we filterweb-cservice.
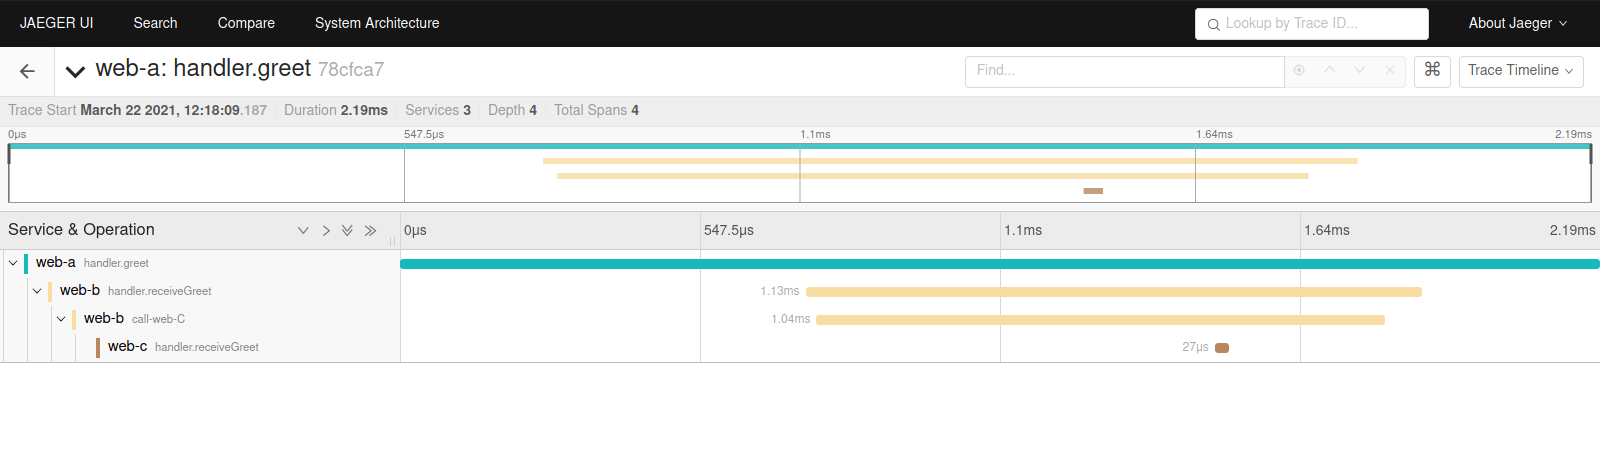
When we look the detail, we will see that tracing will indeed flow from web-a to web-b then finally to web-c.
A single span can cross multiple services/applications, as long as we continue the span context.
Since http request calls there are synchronous calls, this means that in tracing perspective: web-c is part of web-b, and web-b is part of web-a, in other words in tracing perspective: web-a is surely longer than web-b, and web-b is longer than web-c.
Capturing Errors
In some parts of our applications, we want to capture some errors, for Golang Opentracing client, it is just as simple as creating the span tag with key error and value true. Or call ext.Error function (from "github.com/opentracing/opentracing-go/ext"), but I prefer to use ext.LogError which not only tag the span as error, but we can provide error message and log fields.
Let’s put this in web-a.
Usually we check if a process has an error, if it had, then we would call ext.LogError with current span and the error as the param (along with some log fields if needed).
import(
// ...
otlog "github.com/opentracing/opentracing-go/log"
// ...
)
// ...
// skipped for brevity
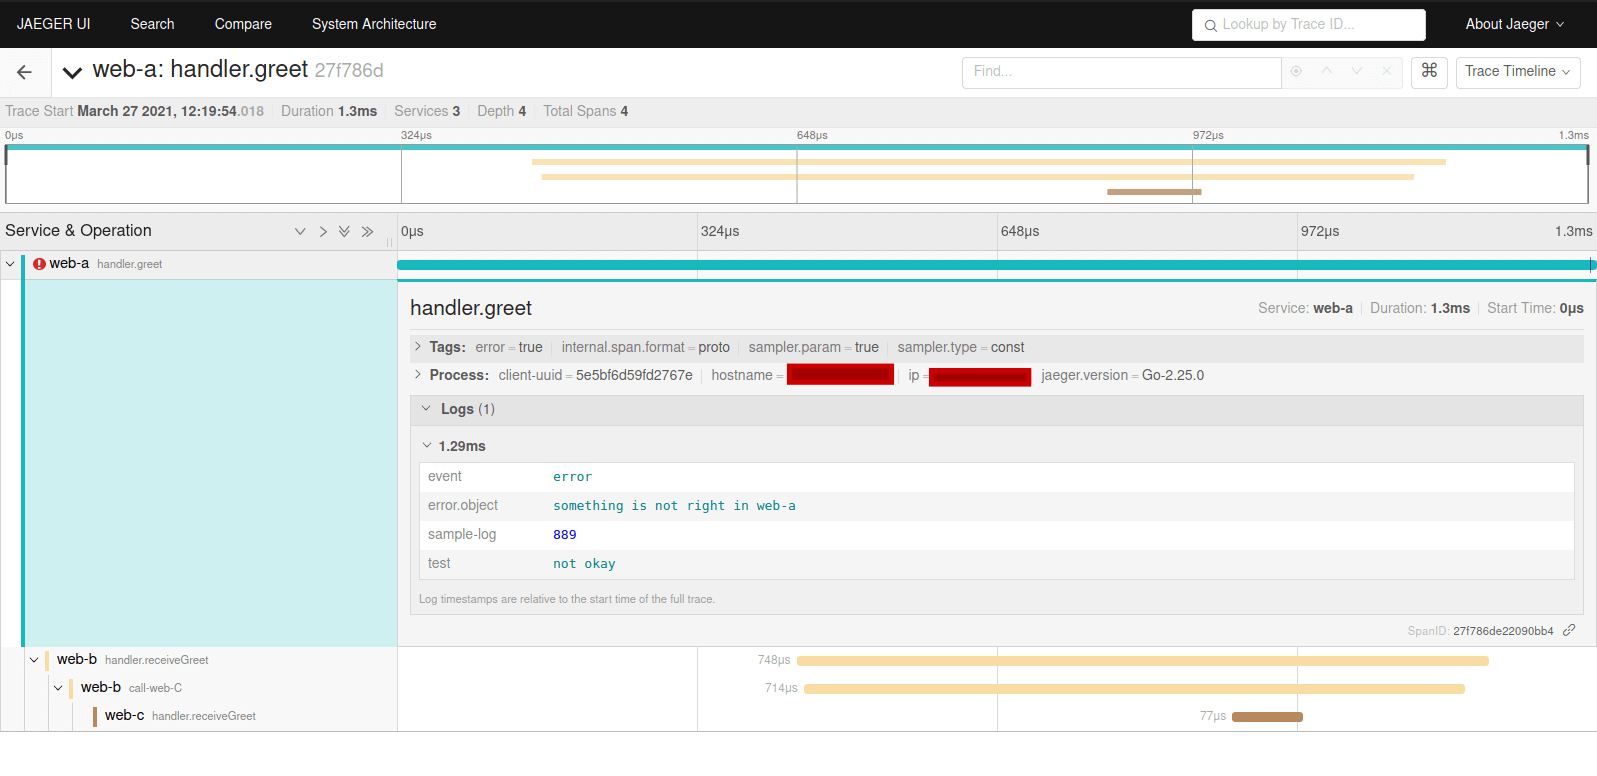
ext.LogError(span, errors.New("something is not right in web-a"), otlog.String("test", "not okay"), otlog.Float64("sample-log", 889.0))
fmt.Fprintf(w, "response from web B: %v", string(bytes))
Now let’s restart web-a and call the greet endpoint from web-a once again. This pretty much will flag the span with a nice alert.
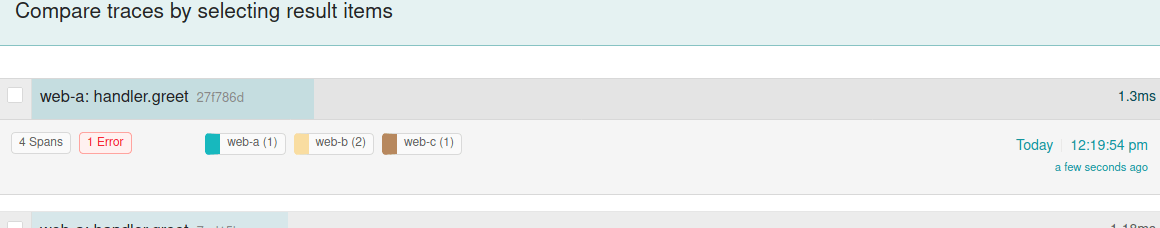
When we look at the detail, we will find the marked span flagged with error as true. Along with it, are error message and log fields that we specify in the code. When we tag the span with error as true, we can then find spans with errors in Jaeger UI search form easily.
Here’s the demonstration code: https://github.com/dwahyudi/golang-jaeger-cross-services-demo